Grundlæggende statistik
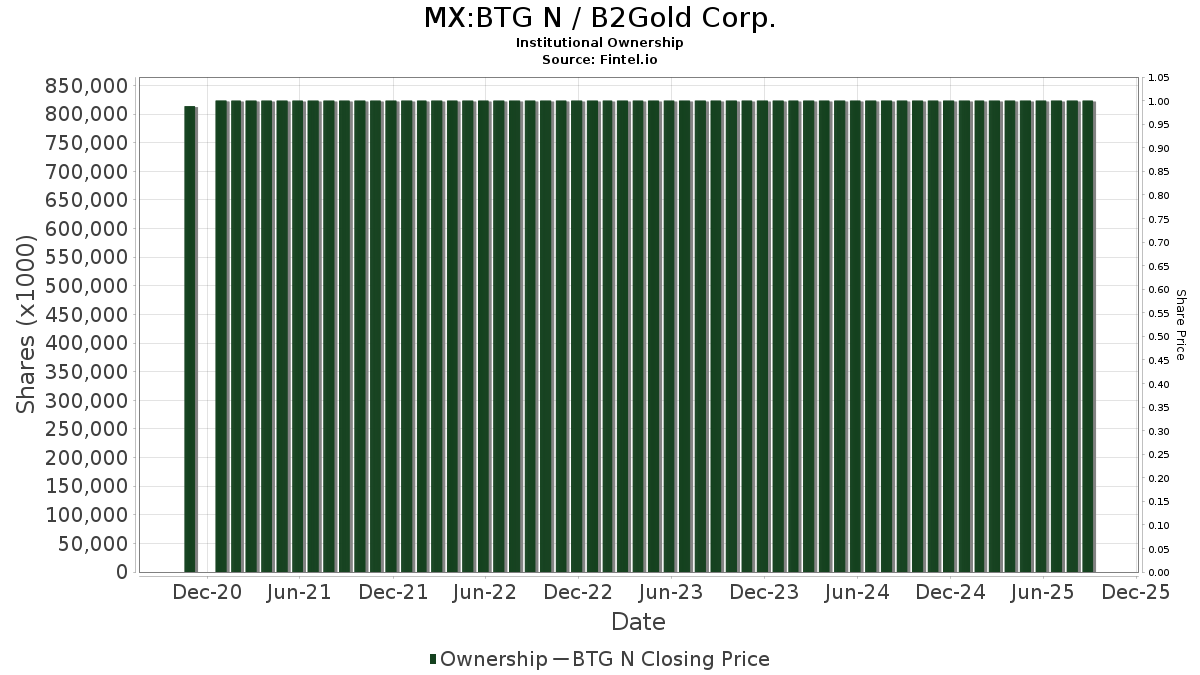
| Institutionelle aktier (lange) | 799.975.592 - 76,11% (ex 13D/G) - change of 7,32MM shares 0,90% MRQ |
| Institutionel værdi (lang) | $ 3.050.699 USD ($1000) |
Institutionelt ejerskab og aktionærer
B2Gold Corp. (MX:BTG N) har 297 institutionelle ejere og aktionærer, der har indsendt 13D/G- eller 13F-formularer til Securities Exchange Commission (SEC). Disse institutioner har i alt 799,975,592 aktier. Største aktionærer omfatter Van Eck Associates Corp, Vanguard Group Inc, Pale Fire Capital SE, D. E. Shaw & Co., Inc., Fmr Llc, American Century Companies Inc, Dimensional Fund Advisors Lp, Two Sigma Investments, Lp, Millennium Management Llc, and Two Sigma Advisers, Lp .
B2Gold Corp. (BMV:BTG N) institutionel ejerskabsstruktur viser aktuelle positioner i virksomheden efter institutioner og fonde, samt seneste ændringer i positionsstørrelse. Større aktionærer kan omfatte individuelle investorer, investeringsforeninger, hedgefonde eller institutioner. Skema 13D angiver, at investoren besidder (eller besidder) mere end 5 % af virksomheden og har til hensigt (eller har til hensigt at) aktivt at forfølge en ændring i forretningsstrategi. Skema 13G indikerer en passiv investering på over 5%.
Fondens stemningsscore
Fund Sentiment Score (fka Ownership Accumulation Score) finder de aktier, der bliver mest købt af fonde. Det er resultatet af en sofistikeret, multi-faktor kvantitativ model, der identificerer virksomheder med de højeste niveauer af institutionel akkumulering. Scoringsmodellen bruger en kombination af den samlede stigning i oplyste ejere, ændringerne i porteføljeallokeringer i disse ejere og andre målinger. Tallet går fra 0 til 100, hvor højere tal indikerer et højere niveau af akkumulering for sine jævnaldrende, og 50 er gennemsnittet.
Opdateringsfrekvens: Dagligt
Se Ownership Explorer, som giver en liste over højest rangerende virksomheder.
AI+ Ask Fintel’s AI assistant about B2Gold Corp..
Select a question to share a public post with an AI-crafted answer.
Thinking of good questions…
13F og NPORT arkivering
Detaljer om 13F-arkivering er gratis. Detaljer om NP-ansøgninger kræver et premium-medlemskab. Grønne rækker angiver nye positioner. Røde rækker angiver lukkede positioner. Klik på linket ikon for at se den fulde transaktionshistorik.
Opgrader
for at låse premium-data op og eksportere til Excel ![]() .
.
| Fil dato | Kilde | Investor | Type | Gennemsnitlig pris (Øst) |
Aktier | Δ Aktier (%) |
Rapporteret Værdi ($1000) |
Δ Værdi (%) |
Port Alloc (%) |
|
|---|---|---|---|---|---|---|---|---|---|---|
| 2026-02-17 | 13F | Point72 Asset Management, L.P. | 6.553.619 | 41,33 | 29.551 | 28,77 | ||||
| 2025-11-14 | 13F | Wolverine Trading, Llc | Put | 234.700 | 37,90 | 1.164 | 94,00 | |||
| 2026-02-05 | 13F | Helikon Investments Ltd | 56.760 | 256 | ||||||
| 2025-11-14 | 13F | Credit Agricole S A | 0 | -100,00 | 0 | |||||
| 2026-04-24 | 13F | Profund Advisors Llc | 144.882 | 5,56 | 656 | 5,98 | ||||
| 2026-02-17 | 13F | Schonfeld Strategic Advisors LLC | 391.553 | -20,31 | 1.766 | -27,43 | ||||
| 2026-02-17 | 13F | Point72 Asset Management, L.P. | Call | 400.500 | 1.806 | |||||
| 2026-02-10 | 13F | Goldman Sachs Group Inc | 9.569.165 | 31,99 | 43.157 | 20,26 | ||||
| 2026-02-18 | 13F | Garton & Associates Financial Advisors LLC | 1.967 | 9 | ||||||
| 2026-02-18 | 13F | State of Tennessee, Treasury Department | 0 | -100,00 | 0 | |||||
| 2026-02-13 | 13F | Marshall Wace, Llp | 8.556.658 | 38.591 | ||||||
| 2025-11-14 | 13F | Point72 (DIFC) Ltd | 175.552 | 167,80 | 869 | 267,80 | ||||
| 2025-11-14 | 13F | Wolverine Trading, Llc | 225.646 | 74,44 | 1.119 | 145,39 | ||||
| 2025-11-14 | 13F | Wolverine Trading, Llc | Call | 296.000 | 3,06 | 1.468 | 44,92 | |||
| 2026-01-15 | 13F | Jaffetilchin Investment Partners, LLC | 54.342 | -71,78 | 245 | -74,29 | ||||
| 2026-01-29 | 13F | Sanctuary Advisors, LLC | 14.182 | -0,80 | 64 | -10,00 | ||||
| 2026-02-12 | 13F | DRW Securities, LLC | 450.000 | 38,20 | 2.030 | 30,57 | ||||
| 2026-02-17 | 13F | Alliancebernstein L.p. | 192.729 | 0,00 | 869 | -8,91 | ||||
| 2025-11-14 | 13F | Nelson, Van Denburg & Campbell Wealth Management Group, LLC | 0 | -100,00 | 0 | -100,00 | ||||
| 2026-02-11 | 13F | Simplex Trading, Llc | Put | 1.035.900 | 50,90 | 4.672 | 155.600,00 | |||
| 2026-02-11 | 13F | Simplex Trading, Llc | 861.072 | 91,80 | 3.883 | 194.050,00 | ||||
| 2026-02-13 | 13F | De Lisle Partners LLP | 300.600 | 0,00 | 1.356 | -8,88 | ||||
| 2026-04-22 | 13F | Stone House Investment Management, LLC | 2.273 | 0,00 | 10 | 0,00 | ||||
| 2026-02-11 | 13F | Simplex Trading, Llc | Call | 2.612.400 | 77,24 | 11.782 | 168.200,00 | |||
| 2026-02-17 | 13F | Quantessence Capital LLC | 0 | -100,00 | 0 | |||||
| 2026-02-17 | 13F | Janus Henderson Group Plc | 845.682 | -45,28 | 3.818 | -50,06 | ||||
| 2025-10-31 | 13F | James Investment Research Inc | 0 | -100,00 | 0 | -100,00 | ||||
| 2026-02-17 | 13F | Elequin Capital Lp | 3.486 | 16 | ||||||
| 2026-01-12 | 13F | Castleview Partners, Llc | 21.000 | 95 | ||||||
| 2026-02-13 | 13F | OMERS ADMINISTRATION Corp | 0 | -100,00 | 0 | |||||
| 2026-02-12 | 13F | CoreCommodity Management, LLC | 0 | -100,00 | 0 | |||||
| 2026-02-17 | 13F | Cetera Investment Advisers | 292.231 | 152,04 | 1.318 | 129,84 | ||||
| 2025-11-14 | 13F | Gluskin Sheff & Assoc Inc | 0 | -100,00 | 0 | |||||
| 2026-04-20 | 13F | Contravisory Investment Management, Inc. | 3.681 | 17 | ||||||
| 2026-01-23 | 13F | Sumitomo Mitsui Trust Holdings, Inc. | 0 | -100,00 | 0 | |||||
| 2026-02-12 | 13F | Dimensional Fund Advisors Lp | 32.161.379 | 3,29 | 145.051 | -5,89 | ||||
| 2026-02-19 | 13F | Mcguire Capital Advisors Inc | 589 | 3 | ||||||
| 2026-02-13 | 13F | Vontobel Holding Ltd. | 72.144 | 25,54 | 325 | 14,08 | ||||
| 2026-01-30 | 13F | R Squared Ltd | 0 | -100,00 | 0 | |||||
| 2026-02-13 | 13F | Causeway Capital Management Llc | 94.491 | 0,00 | 426 | -8,78 | ||||
| 2026-02-17 | 13F | Tower Research Capital LLC (TRC) | 9.503 | -81,73 | 43 | -83,66 | ||||
| 2026-02-17 | 13F | Millennium Management Llc | 23.342.850 | 248,23 | 105.264 | 217,24 | ||||
| 2026-02-17 | 13F | State Of Wisconsin Investment Board | 32.379 | 146 | ||||||
| 2026-01-16 | 13F | Compagnie Lombard Odier SCmA | 0 | -100,00 | 0 | -100,00 | ||||
| 2026-02-13 | 13F/A | Virtus ETF Advisers LLC | 0 | -100,00 | 0 | |||||
| 2026-01-29 | 13F | Atlas Legacy Advisors, LLC | Call | 15.000 | 68 | |||||
| 2026-02-13 | 13F | Schroder Investment Management Group | 4.928.579 | 40,57 | 22.228 | 28,07 | ||||
| 2026-02-10 | 13F | JTC Employer Solutions Trusteee Ltd | 25.900 | 0,00 | 0 | |||||
| 2026-02-17 | 13F | Graham Capital Management, L.P. | 125.493 | 566 | ||||||
| 2026-02-17 | 13F | Two Sigma Investments, Lp | 24.058.488 | 11,97 | 108.504 | 2,02 | ||||
| 2026-01-07 | 13F | Aventura Private Wealth, LLC | 12.189 | 0,00 | 55 | -10,00 | ||||
| 2026-04-20 | 13F | Assenagon Asset Management S.A. | 588.567 | 2.665 | ||||||
| 2026-02-13 | 13F | BNP Paribas Asset Management Holding S.A. | 21.956 | 0 | ||||||
| 2026-02-04 | 13F | Versor Investments LP | 176.900 | -26,84 | 797 | -33,39 | ||||
| 2026-02-06 | 13F | Global Retirement Partners, LLC | 1.160 | 625,00 | 5 | |||||
| 2026-02-09 | 13F | Mondrian Investment Partners LTD | 6.295 | 0,32 | 39 | -11,63 | ||||
| 2026-02-12 | 13F | Northwest & Ethical Investments L.P. | 269.210 | 83,72 | 1.212 | 67,40 | ||||
| 2026-04-21 | 13F | Wesbanco Bank Inc | 10.400 | 0,00 | 47 | 2,17 | ||||
| 2026-04-22 | 13F | KG&L Capital Management,LLC | 0 | -100,00 | 0 | -100,00 | ||||
| 2026-02-05 | 13F | Baader Bank INC | 15.192 | -37,00 | 31 | -42,31 | ||||
| 2026-02-09 | 13F | Huntington National Bank | 0 | -100,00 | 0 | |||||
| 2026-04-22 | 13F | Continuum Advisory, LLC | 14.368 | 0,00 | 65 | 1,56 | ||||
| 2026-04-27 | 13F | Tsfg, Llc | 0 | -100,00 | 0 | |||||
| 2026-04-24 | 13F | TT International Asset Management LTD | 9.469.481 | 211,01 | 42.897 | 329.869,23 | ||||
| 2026-02-12 | 13F | Sprott Inc. | 471.520 | -45,73 | 2.127 | -50,56 | ||||
| 2026-01-30 | 13F | Wealthfront Advisers Llc | 36.476 | 165 | ||||||
| 2026-02-10 | 13F | Easterly Investment Partners Llc | 2.934.687 | 3,86 | 13.235 | -5,37 | ||||
| 2026-02-17 | 13F | Mirabella Financial Services Llp | 0 | -100,00 | 0 | |||||
| 2026-02-04 | 13F | First Eagle Investment Management, LLC | 9.708.102 | -24,57 | 43.712 | -31,28 | ||||
| 2026-02-13 | 13F | Charles Schwab Investment Management Inc | 4.637.523 | 2,41 | 20.908 | -6,62 | ||||
| 2026-04-10 | 13F | Abound Wealth Management | 2.310 | 0,48 | 10 | 0,00 | ||||
| 2026-02-13 | 13F | SRS Capital Advisors, Inc. | 3.000 | 14 | ||||||
| 2026-02-11 | 13F | J.w. Cole Advisors, Inc. | 0 | -100,00 | 0 | |||||
| 2026-02-14 | 13F | Rockefeller Capital Management L.P. | 50.293 | -52,68 | 227 | -57,03 | ||||
| 2026-02-11 | 13F | Allianz Asset Management GmbH | 2.310.916 | -23,30 | 10.419 | -30,07 | ||||
| 2026-02-13 | 13F | Bridgewater Associates, LP | 64.773 | 40,01 | 292 | 28,07 | ||||
| 2026-01-29 | 13F | UBS Group AG | 3.578.411 | 300,31 | 16.139 | 264,78 | ||||
| 2026-01-30 | 13F | Oakworth Capital, Inc. | 0 | -100,00 | 0 | |||||
| 2026-02-10 | 13F | Zweig-DiMenna Associates LLC | 1.384.300 | 6.243 | ||||||
| 2026-02-17 | 13F | Investment Management Corp of Ontario | 163.819 | 232,93 | 739 | 203,70 | ||||
| 2025-11-13 | 13F | Advent Capital Management /de/ | 0 | -100,00 | 0 | -100,00 | ||||
| 2026-02-17 | 13F | Boothbay Fund Management, Llc | 152.885 | 139,19 | 690 | 118,04 | ||||
| 2026-02-11 | 13F | Stirlingshire Investments, Inc. | 56.415 | 254 | ||||||
| 2026-02-12 | 13F | Rossby Financial, LCC | 0 | -100,00 | 0 | |||||
| 2026-01-29 | 13F | IMC-Chicago, LLC | 566.854 | 570,20 | 2.557 | 511,48 | ||||
| 2026-01-29 | 13F | IMC-Chicago, LLC | Put | 394.300 | 118,45 | 1.778 | 99,10 | |||
| 2026-01-29 | 13F | IMC-Chicago, LLC | Call | 243.400 | 0,25 | 1.098 | -8,66 | |||
| 2026-01-09 | 13F | Pacifica Partners Inc. | 0 | -100,00 | 0 | -100,00 | ||||
| 2026-02-06 | 13F | Harvest Portfolios Group Inc. | 420.586 | 42,64 | 1.894 | 29,92 | ||||
| 2026-02-13 | 13F | Mariner, LLC | 249.429 | 3,40 | 1.125 | -5,86 | ||||
| 2026-02-11 | 13F | Group One Trading, L.p. | Put | 1.025.200 | 18,08 | 4.624 | 7,59 | |||
| 2025-11-19 | 13F/A | Regions Financial Corp | 0 | -100,00 | 0 | -100,00 | ||||
| 2026-02-18 | 13F | GWM Advisors LLC | 6.750 | 27,14 | 30 | 15,38 | ||||
| 2026-02-17 | 13F | Quantinno Capital Management LP | 244.547 | 1,84 | 1.103 | -7,24 | ||||
| 2026-02-06 | 13F | Cadence Wealth Management LLC | 227.318 | -7,59 | 1.025 | -15,78 | ||||
| 2026-02-17 | 13F | Perritt Capital Management Inc | 0 | -100,00 | 0 | |||||
| 2026-04-20 | 13F | Ronald Blue Trust, Inc. | 5.350 | -3,60 | 24 | -4,00 | ||||
| 2026-02-17 | 13F | SIG North Trading, ULC | 342.812 | -6,15 | 1.546 | -14,49 | ||||
| 2026-02-06 | 13F | Larson Financial Group LLC | 112 | 0,00 | 1 | |||||
| 2026-02-12 | 13F | Swiss National Bank | 2.489.323 | 1,41 | 11.231 | -7,48 | ||||
| 2026-02-17 | 13F | SIG North Trading, ULC | Put | 383.800 | 19,90 | 1.731 | 9,22 | |||
| 2026-02-10 | 13F | Acadian Asset Management Llc | 2.927.900 | 325,32 | 13 | 333,33 | ||||
| 2026-02-17 | 13F | SIG North Trading, ULC | Call | 967.100 | 31,85 | 4.362 | 20,14 | |||
| 2026-02-11 | 13F | Tradition Wealth Management, LLC | 14.399 | -25,77 | 65 | -33,33 | ||||
| 2026-02-17 | 13F | Woodline Partners LP | 0 | -100,00 | 0 | |||||
| 2026-04-27 | 13F | Leonteq Securities AG | 15.053 | 0,00 | 95 | 1,08 | ||||
| 2026-01-22 | 13F | Castle Wealth Management Llc | 10.617 | 0,00 | 48 | -9,62 | ||||
| 2026-02-13 | 13F | National Bank Of Canada /fi/ | 4.557.557 | -29,81 | 20.435 | -36,02 | ||||
| 2026-02-17 | 13F | Voloridge Investment Management, Llc | 4.744.410 | 21.397 | ||||||
| 2026-01-28 | 13F | U S Global Investors Inc | 0 | -100,00 | 0 | |||||
| 2026-02-10 | 13F | New Republic Capital, LLC | 0 | -100,00 | 0 | |||||
| 2026-04-07 | 13F | Farther Finance Advisors, LLC | 30 | 0 | ||||||
| 2026-02-17 | 13F | Susquehanna International Group, Llp | 11.751.956 | 57,76 | 53.001 | 43,74 | ||||
| 2026-02-17 | 13F | Susquehanna International Group, Llp | Put | 2.579.200 | 164,53 | 11.632 | 141,03 | |||
| 2026-02-17 | 13F | Susquehanna International Group, Llp | Call | 1.553.800 | 26,02 | 7.008 | 14,81 | |||
| 2026-02-17 | 13F | Shelton Capital Management | 0 | -100,00 | 0 | |||||
| 2026-01-27 | 13F | Fiscal Wisdom Wealth Management, LLC | 78.526 | -55,58 | 354 | -61,48 | ||||
| 2026-02-05 | 13F | Cambridge Investment Research Advisors, Inc. | 106.002 | -30,31 | 0 | |||||
| 2026-02-13 | 13F | National Bank Of Canada /fi/ | Call | 988 | -71,22 | 445 | -73,84 | |||
| 2026-02-13 | 13F | First Trust Advisors Lp | 581.925 | 526,54 | 2.620 | 470,81 | ||||
| 2026-02-13 | 13F | Towarzystwo Funduszy Inwestycyjnych Pzu Sa | 0 | -100,00 | 0 | |||||
| 2026-04-08 | 13F | Stonebridge Financial Group, LLC | 10.650 | 0,00 | 48 | 0,00 | ||||
| 2026-01-29 | 13F | Vanguard Group Inc | 56.023.406 | 1,85 | 252.273 | -7,23 | ||||
| 2026-02-17 | 13F | Bank Of America Corp /de/ | 10.961.495 | 11,40 | 49.436 | 1,50 | ||||
| 2026-02-17 | 13F | Russell Investments Group, Ltd. | 1.102.820 | 39,64 | 5.005 | 27,75 | ||||
| 2026-02-13 | 13F | National Bank Of Canada /fi/ | Put | 61 | -85,51 | 27 | -87,02 | |||
| 2026-02-03 | 13F | SBI Securities Co., Ltd. | 28.432 | 17,51 | 128 | 7,56 | ||||
| 2025-12-09 | 13F | Painted Porch Advisors LLC | 0 | -100,00 | 0 | |||||
| 2026-01-27 | 13F | Seeds Investor Llc | 0 | -100,00 | 0 | -100,00 | ||||
| 2026-02-17 | 13F | Scientech Research LLC | 0 | -100,00 | 0 | |||||
| 2026-01-23 | 13F | Gw Henssler & Associates Ltd | 0 | -100,00 | 0 | |||||
| 2026-02-17 | 13F | Jones Financial Companies Lllp | 19.038 | 18,54 | 86 | 7,59 | ||||
| 2026-04-08 | 13F | E Fund Management (Hong Kong) Co., Ltd. | 46.058 | -39,96 | 209 | -59,10 | ||||
| 2026-02-12 | 13F | Scotia Capital Inc. | 63.374 | 4,96 | 286 | -4,36 | ||||
| 2025-11-10 | 13F | Kovitz Investment Group Partners, LLC | 0 | -100,00 | 0 | |||||
| 2026-02-17 | 13F | Tudor Investment Corp Et Al | 2.780.723 | 12.541 | ||||||
| 2025-11-14 | 13F | Jain Global LLC | 0 | -100,00 | 0 | |||||
| 2026-02-19 | 13F | Invesco Ltd. | 7.669.245 | -26,50 | 34.588 | -33,04 | ||||
| 2025-11-14 | 13F | Luminist Capital LLC | 0 | -100,00 | 0 | |||||
| 2026-02-05 | 13F | Allworth Financial LP | 546 | -33,82 | 2 | -50,00 | ||||
| 2026-02-13 | 13F | Manufacturers Life Insurance Company, The | 6.283.749 | 1,68 | 28.352 | -7,22 | ||||
| 2026-02-17 | 13F | Quadrature Capital Ltd | 8.190.760 | 398,83 | 36.929 | 354,96 | ||||
| 2026-02-17 | 13F | FIL Ltd | 10.087.928 | 0,30 | 45.422 | -8,64 | ||||
| 2026-02-12 | 13F | Campbell & CO Investment Adviser LLC | 309.920 | 18,72 | 1.398 | 8,13 | ||||
| 2026-02-13 | 13F | Natixis | 0 | -100,00 | 0 | |||||
| 2026-02-17 | 13F | Aqr Capital Management Llc | 44.750 | 202 | ||||||
| 2026-02-13 | 13F | Wells Fargo & Company/mn | 883.719 | 42,97 | 3.986 | 30,27 | ||||
| 2026-02-13 | 13F | Pinpoint Asset Management (Singapore) Pte. Ltd. | 50.000 | 226 | ||||||
| 2026-02-12 | 13F | Jane Street Group, Llc | Call | 175.600 | 1,21 | 792 | -7,81 | |||
| 2026-02-12 | 13F | Jane Street Group, Llc | 11.391.303 | 180,30 | 51.375 | 155,39 | ||||
| 2026-02-12 | 13F | Jane Street Group, Llc | Put | 307.700 | 101,51 | 1.388 | 83,71 | |||
| 2026-04-14 | 13F | Beacon Investment Advisory Services, Inc. | 385 | 2 | ||||||
| 2026-02-12 | 13F | Hrt Financial Lp | 19.635 | -98,06 | 0 | -100,00 | ||||
| 2026-02-13 | 13F | Lavaca Capital Llc | 10.700 | 0,00 | 48 | -7,69 | ||||
| 2026-04-14 | 13F | Prospera Financial Services Inc | 10.000 | 45 | ||||||
| 2026-02-11 | 13F | LPL Financial LLC | 882.551 | -19,43 | 3.980 | -26,60 | ||||
| 2026-02-19 | 13F/A | Axxcess Wealth Management, Llc | Call | 1 | ||||||
| 2026-02-04 | 13F | Seelaus Asset Management LLC | 63.675 | 0,00 | 287 | -8,60 | ||||
| 2026-02-02 | 13F | Danske Bank A/s | 134.609 | -16,89 | 607 | -23,26 | ||||
| 2026-02-17 | 13F | Two Sigma Securities, Llc | 10.096 | -91,58 | 46 | -92,41 | ||||
| 2026-02-18 | 13F | Zazove Associates Llc | 934.200 | 165,78 | 1.242 | 207,18 | ||||
| 2026-02-11 | 13F | Jpmorgan Chase & Co | 81.247 | -6,33 | 366 | -14,69 | ||||
| 2026-02-11 | 13F | Jpmorgan Chase & Co | Call | 21.100 | 17,88 | 95 | 7,95 | |||
| 2026-01-27 | 13F | TD Waterhouse Canada Inc. | 422.008 | 22,10 | 1.900 | 9,95 | ||||
| 2026-04-15 | 13F | McAlvany Wealth Management LLC | 801.208 | -14,84 | 3.381 | -20,32 | ||||
| 2026-02-09 | 13F | Investors Portfolio Services LLC | 4.380 | 20 | ||||||
| 2026-02-13 | 13F | Stifel Financial Corp | 264.880 | 217,81 | 1.195 | 189,81 | ||||
| 2025-12-16 | 13F | Garde Capital, Inc. | 0 | -100,00 | 0 | |||||
| 2026-02-13 | 13F | BRITISH COLUMBIA INVESTMENT MANAGEMENT Corp | 709.472 | -8,07 | 3.195 | -16,26 | ||||
| 2026-04-13 | 13F | Successful Portfolios LLC | 18.091 | -4,46 | 78 | -10,47 | ||||
| 2026-04-16 | 13F | Roble, Belko & Company, Inc | 0 | -100,00 | 0 | |||||
| 2026-01-22 | 13F | Hager Investment Management Services, Llc | 50 | 0,00 | 0 | |||||
| 2026-04-21 | 13F | GHP Investment Advisors, Inc. | 7.659 | 0,50 | 35 | 0,00 | ||||
| 2026-01-27 | 13F | Retirement Income Solutions, Inc | 17.482 | 0,00 | 79 | -9,30 | ||||
| 2026-02-13 | 13F | American Century Companies Inc | 34.336.389 | 0,79 | 154.643 | -8,20 | ||||
| 2026-02-13 | 13F | Ubs Oconnor Llc | 0 | -100,00 | 0 | |||||
| 2026-02-17 | 13F | Aquatic Capital Management LLC | 1.052.735 | -60,63 | 4.748 | -64,13 | ||||
| 2026-02-17 | 13F | Two Sigma Advisers, Lp | 20.243.680 | 20,46 | 91.299 | 9,75 | ||||
| 2026-02-11 | 13F | Cerity Partners LLC | 12.226 | 55 | ||||||
| 2025-11-14 | 13F | Nomura Holdings Inc | 0 | -100,00 | 0 | |||||
| 2026-02-18 | 13F | Beacon Pointe Advisors, LLC | Call | 37.700 | 36,10 | 170 | 24,09 | |||
| 2026-02-18 | 13F | Beacon Pointe Advisors, LLC | 28.879 | 0,03 | 130 | -8,45 | ||||
| 2025-11-14 | 13F | XTX Topco Ltd | 0 | -100,00 | 0 | -100,00 | ||||
| 2026-02-13 | 13F | Squarepoint Ops LLC | 230.337 | 19,30 | 1.039 | 8,69 | ||||
| 2026-02-13 | 13F | Financial Sense Advisors, Inc. | 0 | -100,00 | 0 | |||||
| 2026-02-19 | 13F | CI Private Wealth, LLC | 33.478 | 30,80 | 119 | -5,56 | ||||
| 2026-02-02 | 13F | Wolverine Asset Management Llc | Put | 200 | 0,00 | 1 | ||||
| 2026-02-13 | 13F | Squarepoint Ops LLC | Call | 17.600 | 0,00 | 79 | -9,20 | |||
| 2026-02-06 | 13F | Pnc Financial Services Group, Inc. | 2.400 | 0,00 | 11 | -9,09 | ||||
| 2026-02-17 | 13F | Toronto Dominion Bank | 3.006.974 | 83,50 | 13.539 | 67,17 | ||||
| 2026-01-28 | 13F | Kingswood Wealth Advisors, Llc | 14.493 | 65 | ||||||
| 2026-02-10 | 13F | CIBC Asset Management Inc | 1.221.355 | -3,21 | 5.502 | -11,69 | ||||
| 2026-02-11 | 13F | Strategic Advocates LLC | 47 | 0,00 | 0 | |||||
| 2026-02-17 | 13F | Lighthouse Investment Partners, LLC | 223.360 | -25,35 | 1.006 | -32,07 | ||||
| 2026-02-10 | 13F | Quantbot Technologies LP | 1.165.024 | -56,30 | 5.254 | -60,18 | ||||
| 2026-02-17 | 13F | Caption Management, LLC | Call | 175.000 | 789 | |||||
| 2026-02-17 | 13F | Caption Management, LLC | 80.000 | 0,00 | 361 | -9,09 | ||||
| 2026-02-18 | 13F | Vermillion & White Wealth Management Group, LLC | 0 | -100,00 | 0 | |||||
| 2026-02-13 | 13F | Dynamic Technology Lab Private Ltd | 221.019 | 148,91 | 997 | 126,59 | ||||
| 2026-02-17 | 13F | Royal Bank Of Canada | 5.144.533 | -37,76 | 23.201 | -43,30 | ||||
| 2026-04-24 | 13F | Medallion Wealth Advisors, LLC | 5.000 | 23 | ||||||
| 2025-11-06 | 13F | CIBC World Markets Inc. | Call | 0 | -100,00 | 0 | -100,00 | |||
| 2026-02-06 | 13F/A | Rathbone Brothers plc | 208.304 | 47,98 | 939 | 35,11 | ||||
| 2026-02-13 | 13F | Cornerstone Financial Management LLC | 121 | 1 | ||||||
| 2026-04-14 | 13F | Nbc Securities, Inc. | 400 | 2 | ||||||
| 2026-02-13 | 13F | Inspire Advisors, LLC | 13.183 | 59 | ||||||
| 2025-11-17 | 13F | Abel Hall, LLC | 0 | -100,00 | 0 | -100,00 | ||||
| 2026-02-17 | 13F | Man Group plc | 400.300 | -62,73 | 1.805 | -66,06 | ||||
| 2026-02-17 | 13F | Amundi | 9.249.011 | 2,76 | 41.713 | -13,05 | ||||
| 2026-04-15 | 13F | Redhawk Wealth Advisors, Inc. | 0 | -100,00 | 0 | -100,00 | ||||
| 2026-02-09 | 13F | Waratah Capital Advisors Ltd. | 0 | -100,00 | 0 | |||||
| 2026-04-21 | 13F | Sicart Associates LLC | 0 | -100,00 | 0 | -100,00 | ||||
| 2026-01-22 | 13F | Massachusetts Financial Services Co /ma/ | 37.114 | 167 | ||||||
| 2026-02-12 | 13F | Bank Of Montreal /can/ | Put | 35.600 | 88,36 | 160 | 72,04 | |||
| 2026-02-12 | 13F | Bank Of Montreal /can/ | Call | 298.300 | -65,79 | 1.343 | -68,83 | |||
| 2026-01-30 | 13F | Carrera Capital Advisors | 0 | -100,00 | 0 | |||||
| 2026-02-12 | 13F | Bank Of Montreal /can/ | 12.800.270 | 9,50 | 57.635 | -0,24 | ||||
| 2026-02-13 | 13F | Quarry LP | 4.610 | -76,03 | 21 | -78,95 | ||||
| 2026-04-21 | 13F | Financial Consulate, Inc | 2.500 | 0,00 | 11 | 0,00 | ||||
| 2026-02-13 | 13F | DLD Asset Management, LP | Put | 3.190.000 | 0,41 | 14.403 | -8,33 | |||
| 2026-02-17 | 13F | Advisory Services Network, LLC | 0 | -100,00 | 0 | |||||
| 2026-01-23 | 13F | Burney Co/ | 152.872 | 19,87 | 689 | 9,19 | ||||
| 2026-04-16 | 13F | Brookstone Capital Management | 14.337 | 15,79 | 65 | 16,36 | ||||
| 2026-02-17 | 13F | Mangrove Partners | 0 | -100,00 | 0 | |||||
| 2026-02-13 | 13F | Global Strategic Management Inc | 528.964 | 140,55 | 2 | -99,84 | ||||
| 2026-02-13 | 13F | 1832 Asset Management L.P. | 50.000 | 226 | ||||||
| 2026-04-07 | 13F | GK Wealth Management LLC | 0 | -100,00 | 0 | -100,00 | ||||
| 2026-04-23 | 13F | Oppenheimer & Co Inc | 0 | -100,00 | 0 | -100,00 | ||||
| 2026-02-17 | 13F | Raymond James Financial Inc | Put | 2.500 | 0,00 | 11 | 0,00 | |||
| 2026-02-17 | 13F | Raymond James Financial Inc | Call | 69.800 | 279 | |||||
| 2026-02-17 | 13F | Raymond James Financial Inc | 769.776 | 32,35 | 3.472 | 20,56 | ||||
| 2026-01-14 | 13F | ORG Partners LLC | 11.312 | -1,65 | 51 | -8,93 | ||||
| 2026-02-12 | 13F | Steward Partners Investment Advisory, Llc | 9.788 | 0,39 | 44 | -8,33 | ||||
| 2026-04-16 | 13F | Heck Capital Advisors, LLC | 0 | -100,00 | 0 | -100,00 | ||||
| 2026-02-13 | 13F | Advyzon Investment Management, LLC | 52.209 | 12,60 | 235 | 2,62 | ||||
| 2026-04-17 | 13F | Cidel Asset Management Inc | 69.000 | 0,00 | 312 | 0,32 | ||||
| 2026-02-09 | 13F | Catalyst Funds Management Pty Ltd | 17.600 | -78,74 | 79 | -80,68 | ||||
| 2026-02-12 | 13F | Federation des caisses Desjardins du Quebec | 373.921 | 3,30 | 1.685 | -5,50 | ||||
| 2026-02-17 | 13F | Public Employees Retirement System Of Ohio | 544.607 | 11,25 | 2.455 | 1,45 | ||||
| 2026-02-06 | 13F | Kingdom Financial Group LLC. | 1.004 | 5 | ||||||
| 2026-02-10 | 13F | Eurizon Capital SGR S.p.A. | 537.613 | 2.442 | ||||||
| 2026-02-18 | 13F | VGI Partners Ltd | 1.370.464 | 6.181 | ||||||
| 2026-02-13 | 13F | MAI Capital Management | 708 | 3 | ||||||
| 2026-04-09 | 13F | Towarzystwo Funduszy Inwestycyjnych Allianz Polska S.A. | 308.200 | -12,32 | 1.397 | -12,80 | ||||
| 2025-11-12 | 13F | Headlands Technologies LLC | 0 | -100,00 | 0 | -100,00 | ||||
| 2026-02-12 | 13F | Groupe la Francaise | 1.150.000 | 9,52 | 5.177 | -0,38 | ||||
| 2026-02-13 | 13F | Great West Life Assurance Co /can/ | 160.218 | -77,32 | 1 | -100,00 | ||||
| 2026-04-21 | 13F | E&G Advisors, LP | 10.000 | 0,00 | 45 | 0,00 | ||||
| 2026-02-06 | 13F | Axxcess Wealth Management, Llc | 60.000 | 3 | ||||||
| 2026-02-13 | 13F | Rhumbline Advisers | 105 | 0,00 | 0 | |||||
| 2026-04-20 | 13F | Independent Wealth Network Inc. | 10.000 | 0,00 | 45 | 0,00 | ||||
| 2026-04-20 | 13F | Independent Wealth Network Inc. | Call | 600 | 3 | |||||
| 2026-01-13 | 13F | Ferguson Wellman Capital Management, Inc | 0 | -100,00 | 0 | |||||
| 2026-02-17 | 13F | Lazard Asset Management Llc | Call | 250.000 | 1.128 | |||||
| 2026-02-11 | 13F | Erste Asset Management GmbH | 175.000 | 792 | ||||||
| 2026-04-15 | 13F | Generali Investments CEE, investicni spolecnost, a.s. | 52.485 | 0,00 | 238 | 0,42 | ||||
| 2026-02-17 | 13F | Brevan Howard Capital Management LP | 173.556 | -39,49 | 783 | -44,89 | ||||
| 2026-02-13 | 13F | Continental General Insurance Co | 0 | -100,00 | 0 | |||||
| 2026-03-26 | 13F/A | Peak6 Llc | Put | 0 | -100,00 | 0 | -100,00 | |||
| 2026-02-11 | 13F | Havemeyer Place LP | 108.594 | 490 | ||||||
| 2025-11-13 | 13F | Prudential Financial Inc | 0 | -100,00 | 0 | -100,00 | ||||
| 2026-01-20 | 13F | Toth Financial Advisory Corp | 0 | -100,00 | 0 | -100,00 | ||||
| 2026-02-02 | 13F | Intact Investment Management Inc. | 1.642.400 | 5.130,57 | 7.395 | 4.670,32 | ||||
| 2026-02-18 | 13F | Mackenzie Financial Corp | 8.193.157 | 472,13 | 37.252 | 426,38 | ||||
| 2026-04-20 | 13F | Kestra Private Wealth Services, Llc | 22.761 | 1,39 | 103 | 1,98 | ||||
| 2025-11-21 | 13F/A | Royal Bank Of Canada | Call | 0 | -100,00 | 0 | -100,00 | |||
| 2026-02-04 | 13F | Swiss Life Asset Management Ltd | 107.289 | 85,79 | 483 | 69,12 | ||||
| 2026-01-30 | 13F | Sigma Planning Corp | 21.000 | -18,29 | 95 | -25,98 | ||||
| 2026-04-27 | 13F | Y-Intercept (Hong Kong) Ltd | 1.697.502 | 1.692,85 | 7.690 | 1.700,70 | ||||
| 2026-02-17 | 13F | Condire Management, LP | 11.265.300 | 50.807 | ||||||
| 2026-02-02 | 13F | Hussman Strategic Advisors, Inc. | 300.000 | 50,00 | 1.353 | 36,67 | ||||
| 2026-04-20 | 13F | Cardinal Point Capital Management, ULC | 112.250 | -6,03 | 509 | -5,58 | ||||
| 2025-11-14 | 13F | Sagard Holdings Management Inc. | 10.680 | 0,00 | 53 | 36,84 | ||||
| 2026-04-21 | 13F | PharVision Advisers, LLC | 0 | -100,00 | 0 | -100,00 | ||||
| 2026-01-30 | 13F | Us Bancorp \de\ | 4.120 | -94,44 | 19 | -95,08 | ||||
| 2026-01-28 | 13F | Arizona State Retirement System | 0 | -100,00 | 0 | -100,00 | ||||
| 2026-03-12 | 13F/A | Peak6 Llc | 117.488 | 530 | ||||||
| 2026-03-12 | 13F/A | Peak6 Llc | Call | 300.000 | -50,54 | 1.353 | -54,93 | |||
| 2026-02-13 | 13F | Van Eck Associates Corp | 104.263.524 | -10,04 | 470 | -17,98 | ||||
| 2026-02-10 | 13F | Td Asset Management Inc | 4.767.858 | 11,73 | 21.496 | 1,88 | ||||
| 2026-02-17 | 13F | MAC Alpha Capital Management, LP | 5.842.923 | 26.312 | ||||||
| 2026-02-17 | 13F | PenderFund Capital Management Ltd. | 0 | -100,00 | 0 | |||||
| 2026-02-17 | 13F | Engineers Gate Manager LP | 281.754 | 303,12 | 1.271 | 268,12 | ||||
| 2026-02-13 | 13F | Public Sector Pension Investment Board | 0 | -100,00 | 0 | |||||
| 2026-02-17 | 13F | Cantor Fitzgerald, L. P. | 0 | -100,00 | 0 | -100,00 | ||||
| 2025-11-14 | 13F | Millennium Management Llc | Call | 0 | -100,00 | 0 | -100,00 | |||
| 2026-02-10 | 13F | Connor, Clark & Lunn Investment Management Ltd. | 17.133.266 | 30,60 | 77.147 | 18,98 | ||||
| 2026-02-12 | 13F | Renaissance Technologies Llc | 2.534.258 | 652,23 | 11.430 | 585,60 | ||||
| 2025-11-14 | 13F | Millennium Management Llc | Put | 0 | -100,00 | 0 | -100,00 | |||
| 2026-04-17 | 13F | Roxbury Financial LLC | 2.589 | 12 | ||||||
| 2026-02-13 | 13F | Walleye Capital LLC | Call | 172.700 | 24.571,43 | 779 | 25.833,33 | |||
| 2026-02-13 | 13F | Walleye Capital LLC | Put | 156.500 | 303,35 | 706 | 267,19 | |||
| 2026-02-13 | 13F | Walleye Capital LLC | 497.213 | 17.663,95 | 2.242 | 17.146,15 | ||||
| 2026-04-20 | 13F | Parkway Wealth Management Group, LLC | 10.514 | 51 | ||||||
| 2026-02-17 | 13F | Matrix Private Capital Group Llc | 22.203 | 0,44 | 100 | -8,26 | ||||
| 2026-04-17 | 13F | Webster Bank, N. A. | 5.880 | 0,00 | 27 | 0,00 | ||||
| 2026-02-17 | 13F | Toronto Dominion Bank | Call | 6.700 | -98,88 | 34 | -98,89 | |||
| 2026-02-09 | 13F | Themes Management Co LLC | 227.619 | 1.025 | ||||||
| 2026-02-10 | 13F/A | Northwestern Mutual Wealth Management Co | 10.005 | 45 | ||||||
| 2026-02-23 | 13F | Virtu Financial LLC | 0 | -100,00 | 0 | |||||
| 2026-02-17 | 13F | Fmr Llc | 35.591.806 | -64,93 | 160.255 | -68,06 | ||||
| 2026-02-13 | 13F | JustInvest LLC | 64.842 | 3,29 | 292 | -5,81 | ||||
| 2026-02-17 | 13F | Grantham, Mayo, Van Otterloo & Co. LLC | 1.406.215 | 330,85 | 6.340 | 292,81 | ||||
| 2026-02-06 | 13F | Resolute Wealth Strategies, LLC | 22.676 | 0,01 | 102 | -8,93 | ||||
| 2025-11-12 | 13F | Aviso Financial Inc. | 0 | -100,00 | 0 | |||||
| 2026-01-30 | 13F | Mitsubishi UFJ Trust & Banking Corp | 458.345 | -9,73 | 2.039 | -18,70 | ||||
| 2026-02-12 | 13F | CIBC Private Wealth Group, LLC | 5.000 | -57,99 | 23 | -62,07 | ||||
| 2026-02-13 | 13F | Winmill & Co. Inc | 300.000 | 1.353 | ||||||
| 2026-04-15 | 13F | FNY Investment Advisers, LLC | 0 | -100,00 | 0 | |||||
| 2026-02-04 | 13F | Atlantic Union Bankshares Corp | 400 | 0,00 | 2 | 0,00 | ||||
| 2026-04-06 | 13F | Stableford Capital Ii Llc | 15.000 | 0,00 | 68 | 0,00 | ||||
| 2026-04-15 | 13F | FNY Investment Advisers, LLC | Call | 0 | -100,00 | 0 | ||||
| 2026-04-13 | 13F | E Fund Management Co., Ltd. | 46.058 | 209 | ||||||
| 2026-02-13 | 13F | Citigroup Inc | 380.219 | 466,54 | 1.714 | 417,82 | ||||
| 2026-02-17 | 13F | Numerai GP LLC | 38.749 | -74,13 | 175 | -76,52 | ||||
| 2025-11-12 | 13F | CIBC Bancorp USA Inc. | 11.903 | 59 | ||||||
| 2026-02-10 | 13F | Moors & Cabot, Inc. | 14.500 | 0,00 | 65 | -8,45 | ||||
| 2026-04-13 | 13F | True Wealth Design, LLC | 1 | 0,00 | 0 | |||||
| 2026-02-18 | 13F | Vident Advisory, LLC | 204.076 | -62,20 | 920 | -65,57 | ||||
| 2026-02-17 | 13F | Qube Research & Technologies Ltd | 1.774.851 | 145,21 | 8.004 | 123,45 | ||||
| 2026-04-16 | 13F | SG Americas Securities, LLC | 384.901 | 108,64 | 2 | |||||
| 2026-02-11 | 13F | Group One Trading, L.p. | Call | 1.912.400 | 301,01 | 8.625 | 265,42 | |||
| 2026-02-11 | 13F | Winton Capital Group Ltd | 198.100 | -80,41 | 893 | -82,16 | ||||
| 2026-02-11 | 13F | Group One Trading, L.p. | 3.121.618 | -5,67 | 14.078 | -14,05 | ||||
| 2026-02-13 | 13F | Merk Investments LLC | 2.000.000 | 0,00 | 9.020 | -8,89 | ||||
| 2026-02-17 | 13F | MIRAE ASSET GLOBAL ETFS HOLDINGS Ltd. | 1.737 | 8 | ||||||
| 2026-02-17 | 13F | Clough Capital Partners L P | 0 | -100,00 | 0 | |||||
| 2026-01-28 | 13F | Mowery & Schoenfeld Wealth Management, LLC | 200 | 0,00 | 1 | |||||
| 2026-02-06 | 13F | EverSource Wealth Advisors, LLC | 5.397 | 5,55 | 24 | -4,00 | ||||
| 2026-02-13 | 13F | Blueshift Asset Management, LLC | 44.646 | 201 | ||||||
| 2026-02-12 | 13F | Litman Gregory Asset Management LLC | 311 | 1 | ||||||
| 2026-02-17 | 13F | Balyasny Asset Management Llc | 1.319.177 | 415,38 | 5.949 | 369,53 | ||||
| 2026-04-02 | 13F | Marex Group plc | 30.101 | 86 | ||||||
| 2026-04-17 | 13F | Bell Investment Advisors, Inc | 238 | 0,00 | 1 | 0,00 | ||||
| 2026-01-15 | 13F | Allspring Global Investments Holdings, LLC | 1.062.000 | -48,84 | 4.782 | -53,40 | ||||
| 2026-02-13 | 13F | Morgan Stanley | 12.635.354 | 39,88 | 56.985 | 27,44 | ||||
| 2025-11-07 | 13F | Shell Asset Management Co | 18.922 | -73,30 | 0 | |||||
| 2026-02-04 | 13F | Centric Wealth Management | 28.991 | 28,85 | 142 | 43,88 | ||||
| 2026-02-17 | 13F | Jump Financial, LLC | 2.014.862 | 2,62 | 9.087 | -6,49 | ||||
| 2026-01-29 | 13F | Ashton Thomas Private Wealth, LLC | 66.582 | -67,39 | 300 | -70,27 | ||||
| 2026-02-17 | 13F | Price T Rowe Associates Inc /md/ | 7.294.502 | 33 | ||||||
| 2026-02-13 | 13F | Gts Securities Llc | 0 | -100,00 | 0 | |||||
| 2026-02-17 | 13F | Canada Pension Plan Investment Board | 0 | -100,00 | 0 | -100,00 | ||||
| 2025-12-01 | 13F | Groupama Asset Managment | 1.696 | 153,74 | ||||||
| 2026-04-22 | 13F | Pictet Asset Management Holding SA | 282.779 | 12,30 | 1.281 | 12,78 | ||||
| 2026-01-27 | 13F | Zurcher Kantonalbank (Zurich Cantonalbank) | 387.839 | 11,05 | 1.749 | 1,27 | ||||
| 2026-02-10 | 13F | Bank of New York Mellon Corp | 371.744 | 2,64 | 1.677 | -6,47 | ||||
| 2026-02-17 | 13F | Advisor Group Holdings, Inc. | 77.146 | -5,88 | 348 | -3,88 | ||||
| 2026-02-10 | 13F | Tidemark, LLC | 100 | 0 | ||||||
| 2025-11-05 | 13F | Caliber Wealth Management, LLC / KS | 0 | -100,00 | 0 | |||||
| 2026-02-12 | 13F | Quadrant Capital Group Llc | 181 | 448,48 | 1 | |||||
| 2026-02-13 | 13F | Neuberger Berman Group LLC | 68.175 | 126,22 | 307 | 106,04 | ||||
| 2026-04-07 | 13F | Signaturefd, Llc | 22.896 | 3,06 | 104 | 3,00 | ||||
| 2026-02-13 | 13F | Centiva Capital, LP | 0 | -100,00 | 0 | |||||
| 2026-02-13 | 13F | Ubs Asset Management Americas Inc | 360.921 | 1.628 | ||||||
| 2026-02-13 | 13F | Eschler Asset Management LLP | 469.257 | 2.116 | ||||||
| 2026-04-17 | 13F | Brave Asset Management Inc | 30.000 | 0,00 | 136 | 0,00 | ||||
| 2026-02-12 | 13F | Nuveen, LLC | 982.333 | -82,91 | 4.429 | -84,42 | ||||
| 2026-04-16 | 13F | SG Americas Securities, LLC | Call | 32.900 | 0 | |||||
| 2026-03-06 | 13F | Hsbc Holdings Plc | 0 | -100,00 | 0 | |||||
| 2026-02-17 | 13F | Farringdon Capital, Ltd. | 14.114 | 64 | ||||||
| 2026-04-14 | 13F | West Branch Capital LLC | 1.661 | 0,00 | 8 | 0,00 | ||||
| 2026-02-17 | 13F | DZ BANK AG Deutsche Zentral Genossenschafts Bank, Frankfurt am Main | 1.000.000 | 4.510 | ||||||
| 2026-04-13 | 13F | Hm Payson & Co | 0 | -100,00 | 0 | -100,00 | ||||
| 2026-01-28 | 13F | Ruffer LLP | 454.824 | 2.054 | ||||||
| 2026-01-29 | 13F | Concurrent Investment Advisors, LLC | 26.079 | 17,52 | 118 | 7,34 | ||||
| 2025-11-14 | 13F | SummitTX Capital, L.P. | 0 | -100,00 | 0 | |||||
| 2026-04-08 | 13F | Capital Advisors Wealth Management, LLC | 12.000 | 0,00 | 54 | 0,00 | ||||
| 2026-02-17 | 13F | ExodusPoint Capital Management, LP | 0 | -100,00 | 0 | -100,00 | ||||
| 2025-11-14 | 13F | Caption Management, LLC | Put | 0 | -100,00 | 0 | -100,00 | |||
| 2026-02-10 | 13F | Bnp Paribas Arbitrage, Sa | 6.722.021 | 264,64 | 30.316 | 232,23 | ||||
| 2026-02-12 | 13F | Commonwealth Equity Services, Llc | 86.685 | 17,63 | 391 | |||||
| 2026-04-17 | 13F | AdvisorNet Financial, Inc | 2.550 | 0,00 | 12 | 0,00 | ||||
| 2026-02-17 | 13F | Invenomic Capital Management LP | 0 | -100,00 | 0 | |||||
| 2026-02-17 | 13F | Susquehanna Fundamental Investments, Llc | 0 | -100,00 | 0 | |||||
| 2026-02-17 | 13F | Creative Planning | 134.276 | 6,97 | 606 | -2,58 | ||||
| 2026-04-27 | 13F | Oxbow Advisors, LLC | 76.485 | 0,00 | 346 | 0,58 | ||||
| 2026-02-17 | 13F | Maryland State Retirement & Pension System | 684.556 | -0,78 | 3.084 | -9,56 | ||||
| 2026-02-09 | 13F | Geode Capital Management, Llc | 1.631.425 | 12,45 | 7.919 | 2,68 | ||||
| 2026-02-04 | 13F | Independent Advisor Alliance | 0 | -100,00 | 0 | |||||
| 2026-02-17 | 13F | Citadel Advisors Llc | 3.442.629 | -14,73 | 15.526 | -22,31 | ||||
| 2026-04-16 | 13F | SG Americas Securities, LLC | Put | 17.500 | 0 | |||||
| 2026-02-17 | 13F | Citadel Advisors Llc | Put | 2.196.000 | 55,84 | 9.904 | 41,98 | |||
| 2026-02-13 | 13F | Arrowstreet Capital, Limited Partnership | 10.428.546 | -42,61 | 46.988 | -47,74 | ||||
| 2026-02-17 | 13F | Citadel Advisors Llc | Call | 1.189.200 | 123,74 | 5.363 | 103,92 | |||
| 2026-01-14 | 13F | Spire Wealth Management | 0 | -100,00 | 0 | -100,00 | ||||
| 2025-11-21 | 13F/A | Royal Bank Of Canada | Put | 0 | -100,00 | 0 | -100,00 | |||
| 2026-04-27 | 13F | PFG Investments, LLC | 16.464 | 0,04 | 75 | 0,00 | ||||
| 2026-02-17 | 13F | Oxford Asset Management Llp | 40.465 | -75,58 | 182 | -59,28 | ||||
| 2026-02-17 | 13F | D. E. Shaw & Co., Inc. | 36.242.057 | 208,49 | 163.393 | 181,04 | ||||
| 2026-02-13 | 13F | Walleye Trading LLC | Put | 16.100 | 73 | |||||
| 2026-02-13 | 13F | Walleye Trading LLC | Call | 6.400 | 29 | |||||
| 2026-02-13 | 13F | Police & Firemen's Retirement System of New Jersey | 467.097 | 0,00 | 2.106 | -8,83 | ||||
| 2026-02-05 | 13F | HighMark Wealth Management LLC | 0 | -100,00 | 0 | |||||
| 2026-02-09 | 13F | Genus Capital Management Inc. | 650.040 | 0,00 | 2.931 | -8,84 | ||||
| 2026-02-13 | 13F | Flow Traders U.s. Llc | 0 | -100,00 | 0 | |||||
| 2026-02-03 | 13F | International Assets Investment Management, Llc | 0 | -100,00 | 0 | -100,00 | ||||
| 2026-04-17 | 13F | Vermillion Wealth Management, Inc. | 1.048 | 0,00 | 5 | 0,00 | ||||
| 2026-02-13 | 13F | Aigen Investment Management, Lp | 0 | -100,00 | 0 | |||||
| 2026-01-14 | 13F | Eagle Rock Investment Company, Llc | 0 | -100,00 | 0 | |||||
| 2025-11-14 | 13F | Point72 Asia (Singapore) Pte. Ltd. | 135.614 | 671 | ||||||
| 2026-02-17 | 13F | New Vernon Capital Holdings II LLC | 2.459 | 15 | ||||||
| 2026-02-17 | 13F | Artisan Partners Limited Partnership | 137.200 | 24,28 | 618 | 13,21 | ||||
| 2025-11-12 | 13F | Nikko Asset Management Americas, Inc. | 97.810 | 0,00 | 483 | 37,22 | ||||
| 2026-01-08 | 13F | Wealth Enhancement Advisory Services, Llc | 0 | -100,00 | 0 | -100,00 | ||||
| 2026-02-12 | 13F | StoneX Group Inc. | 118.518 | 2,15 | 535 | -6,97 | ||||
| 2026-02-17 | 13F | Prelude Capital Management, Llc | 657.500 | 17,41 | 2.965 | 7,00 | ||||
| 2026-02-10 | 13F | Norges Bank | 16.730.740 | 75.333 | ||||||
| 2026-02-13 | 13F/A | Alberta Investment Management Corp | 0 | -100,00 | 0 | |||||
| 2026-01-21 | 13F/A | Euro Pacific Asset Management, LLC | 7.584.250 | 0,53 | 34 | -8,33 | ||||
| 2025-11-12 | 13F | Forge First Asset Management Inc. | 1.652.400 | 8.166 | ||||||
| 2026-02-13 | 13F | Macquarie Group Ltd | 0 | -100,00 | 0 | |||||
| 2026-02-13 | 13F | Caitong International Asset Management Co., Ltd | 0 | -100,00 | 0 | |||||
| 2026-04-17 | 13F | PKO Investment Management Joint-Stock Co | 555.277 | 20,71 | 2.517 | 21,36 | ||||
| 2026-02-13 | 13F | Pale Fire Capital SE | 39.311.603 | -21,40 | 177.295 | -28,39 | ||||
| 2026-02-12 | 13F | Arbiter Partners Capital Management LLC | 25.000 | 0,00 | 113 | -8,94 | ||||
| 2026-02-10 | 13F | Envestnet Asset Management Inc | 0 | -100,00 | 0 | |||||
| 2026-02-13 | 13F | Walleye Trading LLC | 67.198 | 303 | ||||||
| 2026-02-10 | 13F | CIBC World Markets Inc. | 2.888.281 | 132,69 | 12.997 | 111,88 | ||||
| 2026-04-24 | 13F | Walker Asset Management, LLC | 11.200 | 0,00 | 51 | 0,00 | ||||
| 2026-02-06 | 13F | HighTower Advisors, LLC | 17.071 | 3,02 | 77 | -7,32 | ||||
| 2026-02-12 | 13F | BlackRock, Inc. | 2.065.492 | 244,26 | 9.315 | 213,74 | ||||
| 2026-02-13 | 13F | Bank Of Nova Scotia | 962.655 | 58,75 | 4.334 | 44,56 | ||||
| 2026-01-07 | 13F | Magnus Financial Group LLC | 0 | -100,00 | 0 | -100,00 | ||||
| 2025-11-14 | 13F | Cubist Systematic Strategies, LLC | 4.251.774 | 21.042 | ||||||
| 2026-02-13 | 13F | Toroso Investments, LLC | 25.262 | 114 | ||||||
| 2026-02-13 | 13F | Barclays Plc | 530.568 | -0,19 | 2.393 | -9,08 | ||||
| 2026-02-11 | 13F | Deutsche Bank Ag\ | 15.447.214 | 68,54 | 69.667 | 53,56 | ||||
| 2026-02-11 | 13F | Franklin Resources Inc | 8.772.440 | -10,12 | 39.499 | -18,12 | ||||
| 2026-02-11 | 13F | 111 Capital | 19.365 | 87 | ||||||
| 2026-02-09 | 13F | Legal & General Group Plc | 7.206.782 | 13,36 | 32.492 | 3,36 | ||||
| 2026-02-10 | 13F | Monaco Asset Management SAM | 0 | -100,00 | 0 | |||||
| 2026-02-09 | 13F | Harbour Investments, Inc. | 3.760 | 0,00 | 17 | -11,11 | ||||
| 2026-02-09 | 13F | Jefferies Financial Group Inc. | 12.135 | 55 |